Plot observations
plot_obs.RdPlot observations
Examples
aeme_file <- system.file("extdata/aeme.rds", package = "AEME")
aeme <- readRDS(aeme_file)
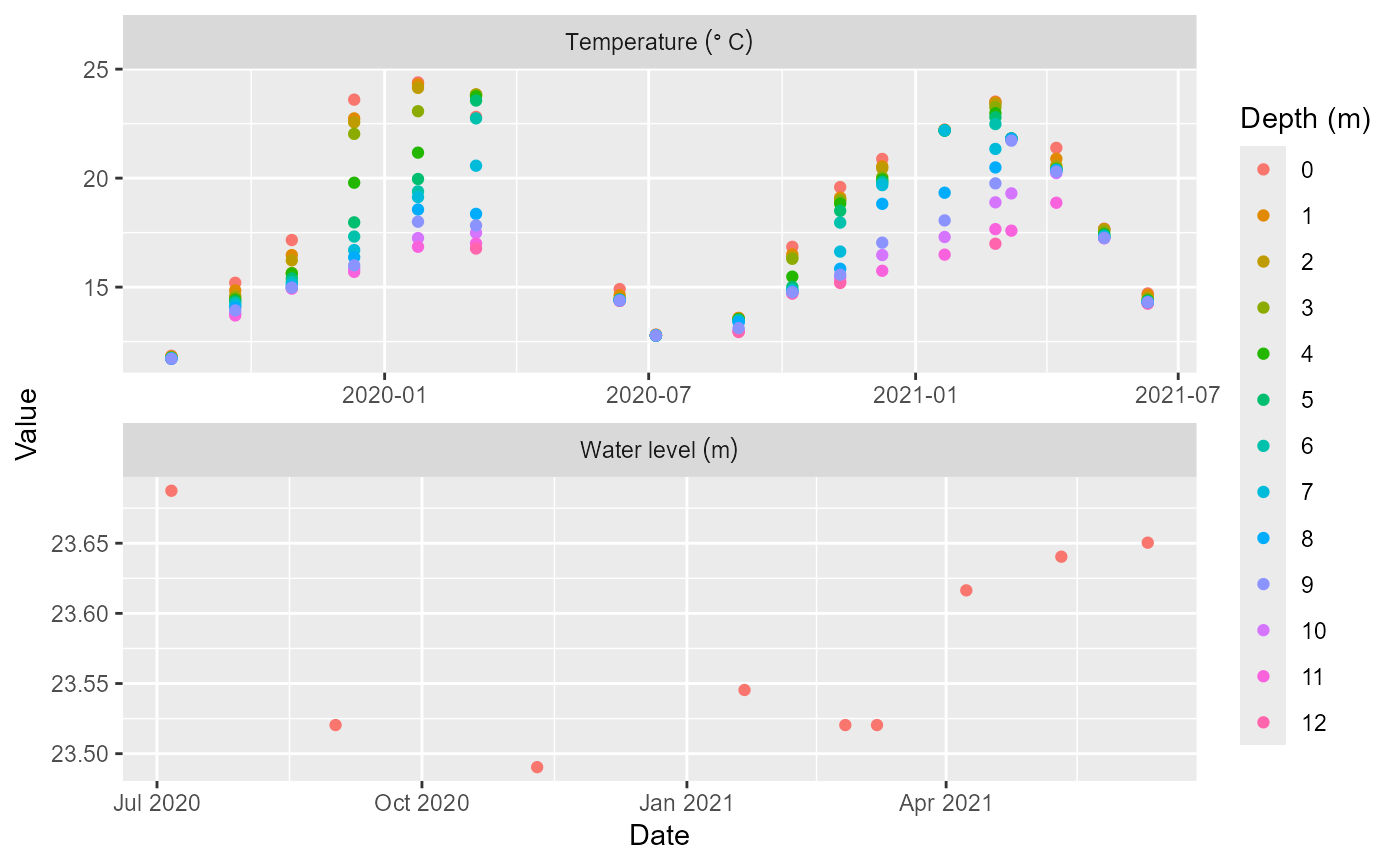
plot_obs(aeme = aeme, var_sim = c("HYD_temp", "LKE_lvlwtr"))


plot_obs.RdPlot observations
aeme_file <- system.file("extdata/aeme.rds", package = "AEME")
aeme <- readRDS(aeme_file)
plot_obs(aeme = aeme, var_sim = c("HYD_temp", "LKE_lvlwtr"))
