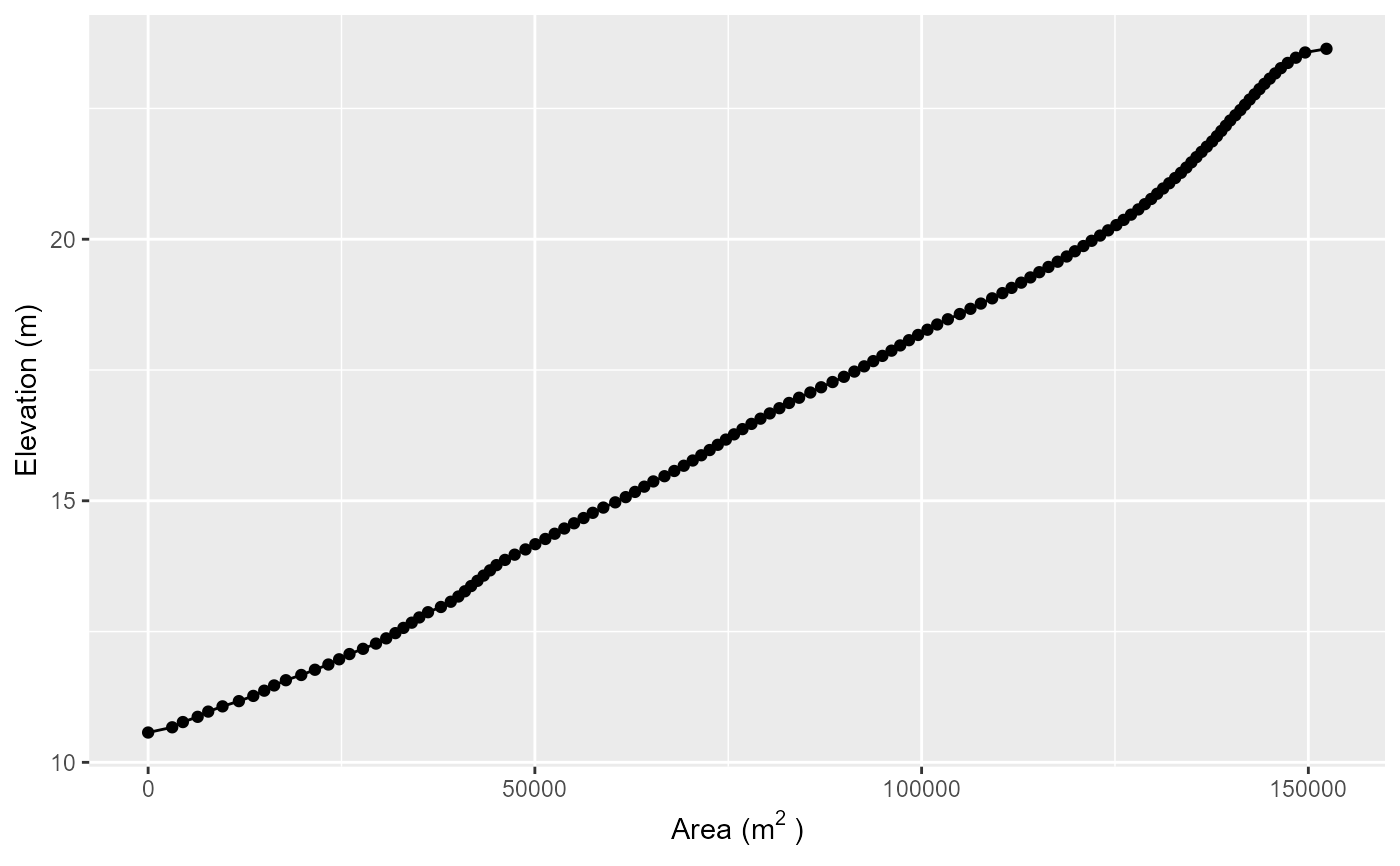
Plot hypsograph
plot_hyps.RdPlot hypsograph
Arguments
- aeme
aeme; object.
- y
Character; column name in hypsograph data to plot on y-axis. Can be either 'elev' or 'depth'.
- add_surface
Logical; if TRUE, add a horizontal line representing the lake surface elevation. Default is FALSE.
- incl_ext_elev
Logical; if TRUE, include the external elevation in the hypsograph plot. Default is FALSE.
Examples
aeme_file <- system.file("extdata/aeme.rds", package = "AEME")
aeme <- readRDS(aeme_file)
plot_hyps(aeme = aeme)
